Passenger Waiting Time is defined as the actual time a prospective passenger waits after registering a hall call (or entering the waiting queue if a call has already been registered) until the responding elevator doors begin to open. If the responding elevator doors are already open when a passenger arrives, the waiting time is taken as zero.
Passenger Transit Time is the time from when the elevator doors begin to open (to admit a passenger) until they begin to open again at the passenger’s destination. If the elevator doors are already open upon the passenger’s arrival, the transit time begins at that moment.
Time to Destination is the sum of the Passenger Waiting Time and the Passenger Transit Time. Elevate reports both the Average Journey Time and the Longest Journey Time.
The Average Waiting Time and Time to Destination graph is plotted in 5-minute intervals. The lower line shows the Average Waiting Time; the upper line shows the Time to Destination. The difference between the two lines represents the Passenger Transit Time.
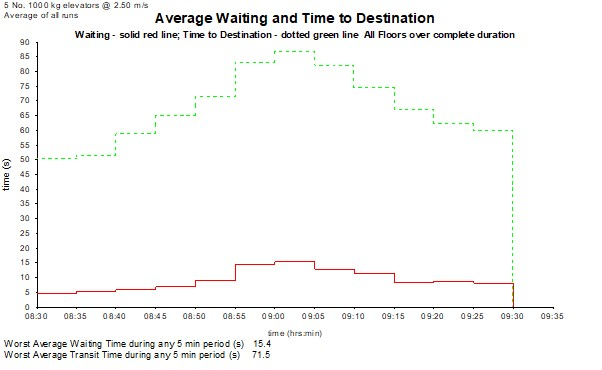
Worst Average Waiting Time during any 5-minute period and Worst Average Transit Time during any 5-minute period are key metrics aligned with CIBSE Guide D 2020 Section 4 design criteria (specifically 4.8.2). This section recommends using the highest values calculated for any 5-minute period across the full simulation duration.
If you apply a time limit (e.g., using a filter), the result may also reflect the following 5-minute window, as waiting or transit time peaks can lag behind demand peaks in transient profiles.
If you require detailed numeric values for each 5-minute interval, you can use the Data button in the Results Graphs dialog box within Elevate.
Was this article helpful?
That’s Great!
Thank you for your feedback
Sorry! We couldn't be helpful
Thank you for your feedback
Feedback sent
We appreciate your effort and will try to fix the article