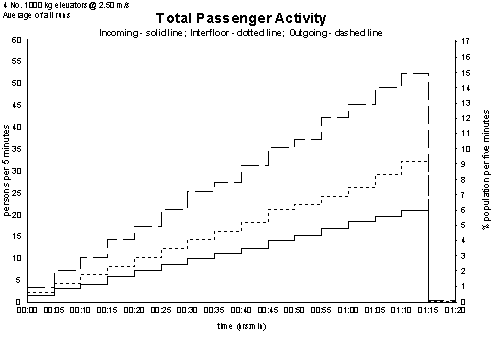
Total Passenger Activity plots the traffic generated from your inputs in Passenger Data. This is shown as a stacked graph:
- Bottom line: Incoming traffic (from Home floor)
- Middle section: Adds interfloor traffic
- Top line: Adds outgoing traffic (to Home floor)
This graph helps visualize overall traffic volume and distribution by type.
You can view the graph for:
- Any individual simulation run
- The average across all simulation runs
Example Total Passenger Activity graph:
Frequently Asked Question
The percentage peak is based on the total population entered in Building Data, before accounting for absenteeism.
For example:
- If the template targets a 10% peak and the total population is 1000, with 0% absenteeism, the peak will be 100 persons per 5 minutes and 10%.
- If 10% absenteeism is applied, then the peak will be 90 persons per 5 minutes and 9%.
Tip: If you want the graph to peak at the template’s defined percentage, adjust the population size instead of using the absenteeism setting.
Also, if any population is assigned to entrance floors, Elevate assumes those individuals do not use the elevator for arrival/departure (only for interfloor travel). This further reduces the total elevator demand and may lower the peak values seen on the graph.
Was this article helpful?
That’s Great!
Thank you for your feedback
Sorry! We couldn't be helpful
Thank you for your feedback
Feedback sent
We appreciate your effort and will try to fix the article