Spatial Plots provide a visual trace of each elevator car’s movement throughout a simulation run. This plot allows you to see where and when each car stops, moves, or idles over time.
- Selection Options:
- You can choose to plot all cars together for an overview.
- Or you can view the trace for each individual car separately.
- Simulation Scope: Spatial plots are available for any single run (not averages).
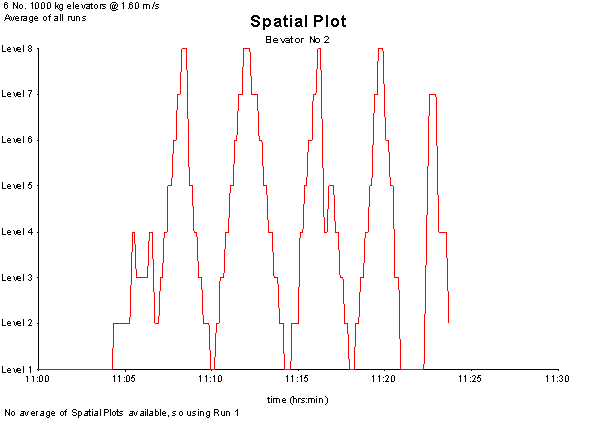
Example Spatial Plot graph:
Was this article helpful?
That’s Great!
Thank you for your feedback
Sorry! We couldn't be helpful
Thank you for your feedback
Feedback sent
We appreciate your effort and will try to fix the article