Use Next and Back to switch between the inputs, plots, and tabulated results.
A control is provided to allow you to select which plot to view.
![]()
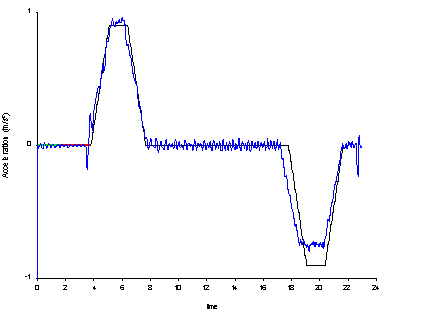
Distance, Velocity, Acceleration, and Jerk plots are available. The ideal plot is shown in black, and the measured values in blue.
The ideal and measured values are "best fit" automatically. However, you can also manually align ideal and measured plots using the ![]() controls. To revert to the automatic fit, select Fit ideal to measured data from the Analysis menu.
controls. To revert to the automatic fit, select Fit ideal to measured data from the Analysis menu.
Once aligned, the ideal measurements can be reviewed and applied in Elevate simulations.
Select the Next button to see supplementary results and the data used to plot the ideal curves.
The plots can be copied from Motion to other software packages using the Copy button.
There is some duplication between the Kinematics Tool and the Motion tool. In a future upgrade, all functionality will be provided through the Motion tool and the Kinematics tools will be discontinued.
Was this article helpful?
That’s Great!
Thank you for your feedback
Sorry! We couldn't be helpful
Thank you for your feedback
Feedback sent
We appreciate your effort and will try to fix the article