Passenger Transit Time is the time from when the responding elevator doors begin to open until they begin to open again at the passenger’s destination. If the elevator doors are already open when the passenger arrives, the transit time starts from the time of arrival.
Elevate presents a graph of passenger transit time distribution in two ways:
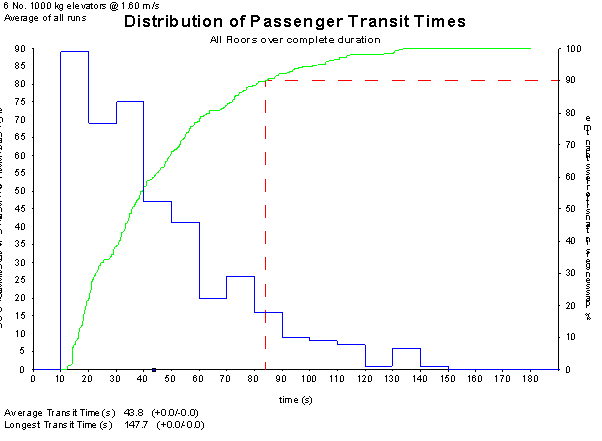
- Right-hand Y axis (Percentage): Shows the cumulative percentage of passengers whose transit times are less than or equal to the values on the X axis. A dotted line marks the 90th percentile.
- Left-hand Y axis (Passenger Count): Displays the number of passengers whose transit times fall within each specified time range (i.e., histogram-style distribution).
Elevate also provides:
- Average Transit Time
- Longest Transit Time
- Range (if multiple simulations): When more than one simulation is run per configuration, Elevate reports an average with a range (e.g. 42.6 (+3.4 / -2.1)).
Was this article helpful?
That’s Great!
Thank you for your feedback
Sorry! We couldn't be helpful
Thank you for your feedback
Feedback sent
We appreciate your effort and will try to fix the article